
Results and analytics
What each number means and how it is counted: shown, seen, interacted, closed, conversions, conversion rate and new leads, with devices, sources and insights.
There are two places for numbers. Analytics in the left menu covers every campaign on every website. Each campaign's own page covers that campaign.
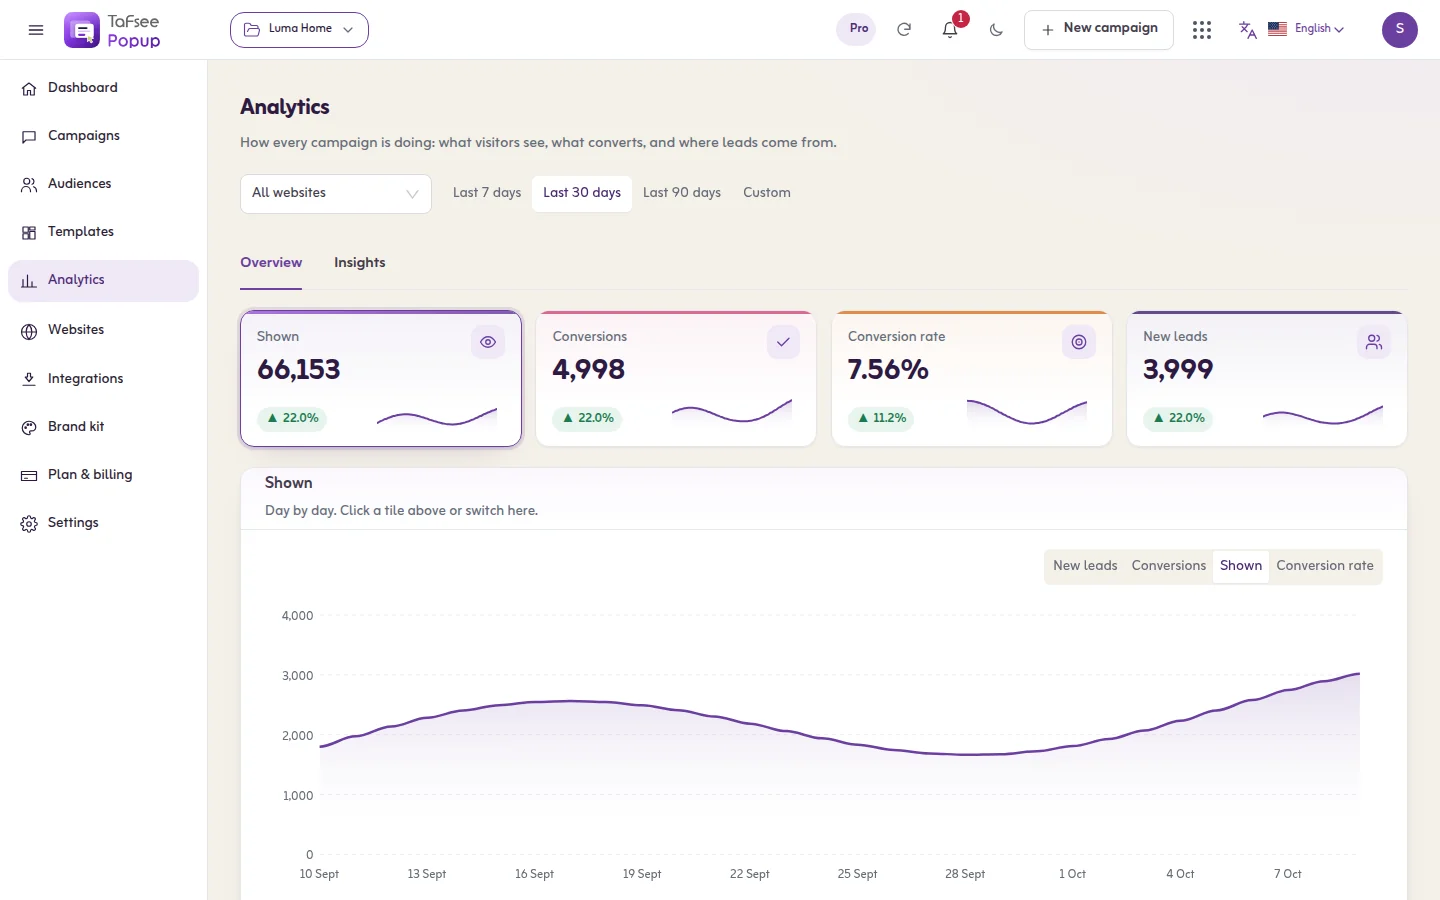
What each number means
- Shown: the number of times the campaign appeared on a page.
- Seen: the visitor could really see it. A popup counts at once. An inline campaign counts when at least half of it is in the visible part of the page.
- Interacted: they clicked, typed or played.
- Closed: they closed it.
- Conversions: they completed the goal (signed up, or pressed a button you marked as the goal). A visitor converts at most once a day, however many times they submit.
- Conversion rate: conversions divided by times shown.
- New leads: people whose first sign-up was in this period. A person who signs up again is not a new lead.
How it is counted
- Days run midnight to midnight UTC.
- Search engine crawlers, link previews and automated browsers are not counted.
- Test leads are left out of the numbers.
- New visits appear within a minute.
- Visits from IP addresses you listed under Don't count visits from these IP addresses are not counted. See Settings.
- Visitors whose browser asks not to be tracked see no campaigns and are not counted, when Respect Do Not Track is on.
- The campaigns list shows all-time figures. Pages with a period switch show that period.
A draft has no numbers. Counting starts the moment the campaign is published and a visitor sees it.
The Analytics page
- Tiles for the main figures, each with its three device numbers. Click a tile to draw it in the chart.
- Daily trend, with Split by device.
- By campaign: High rates on low traffic can mislead. Give them time.
- What kind of campaign works: conversions by campaign type.
- Where your leads are: new leads by the country they signed up from.
- Export CSV.
A campaign's Analytics tab
- From shown to converted: how many showings reached each step. Bars are shares of showings.
- Devices: showings and conversion rate on each kind of device.
- Where leads came from: The utm_source they arrived with, else the site that sent them.
- Countries and pages, with the conversion rate of each page.
- About these numbers: the notes about counting, with the time of the last recorded activity.
Insights
Open the Insights tab of Analytics, or a campaign's Insights tab.
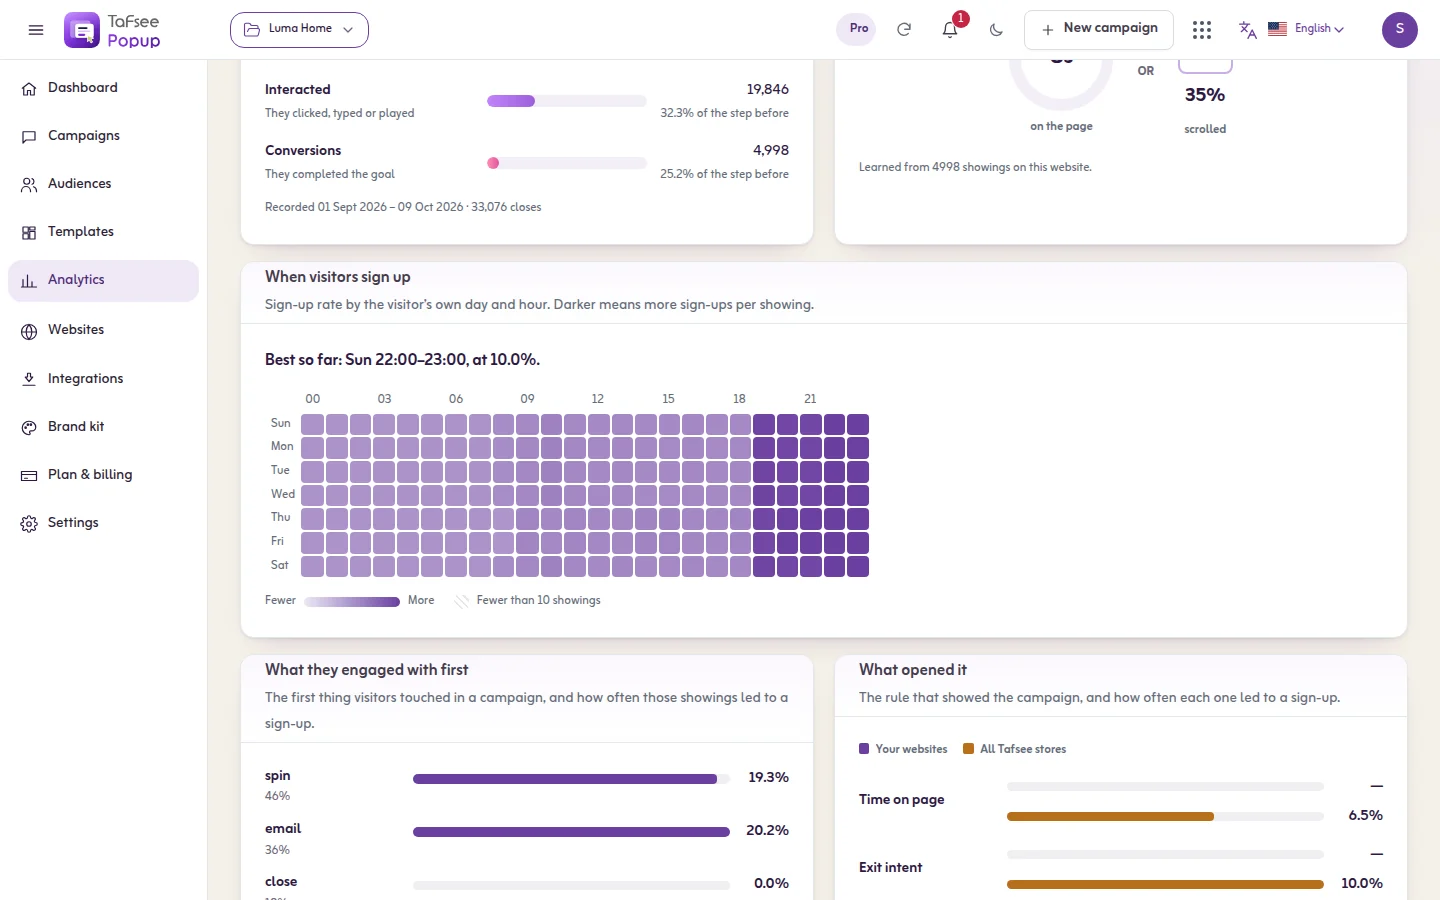
- When visitors sign up: sign-up rate by the visitor's own day and hour.
- What opened it, How long they had been on the page and How far they had scrolled.
- Time to sign up and Time before closing, as medians.
- What they engaged with first: the first thing visitors touched.
- What to try next: Only changes the data clearly supports: each one compares at least 100 showings on each side and passes a significance test.
- Best match for your store: the kinds of campaign most likely to convert on your sites.
Patterns from other stores are counts only, never leads or visitors, and a number is shown only when at least three stores stand behind it. You can stop sharing your own anonymous patterns in Privacy and data.
If it does not work
- Once your campaigns are live on your site, every showing, sign-up and lead lands here, across all your campaigns and websites.
- A version's numbers are lower than the campaign's: an A/B test counts from the day the test started.
- Your own test visits changed the numbers: add your IP address under Don't count visits from these IP addresses, or use See it as a new visitor, which is not counted.
Related
Last updated: October 12, 2026